Mobilized Construction
Fixing our roads, one pothole at the time.
Desktop App
UX Designer
4 Weeks
Desktop App
UX Designer
4 Weeks
Mobilized Construction
Fixing our roads, one pothole at the time.
Desktop App
UX Designer
4 Weeks
Desktop App
UX Designer
4 Weeks

Mobilized Construction
Fixing our roads, one pothole at the time.
Desktop App
UX Designer
4 Weeks
Desktop App
UX Designer
4 Weeks

OVERVIEW SECTION
Key Concepts
Problem
Governments currently run road inspections to survey the roads condition.
They are:
• Subjective, i.e. they are affected by human error
• Time consuming
• Expensive
Solution
Mobilized Construction provides councils and local governments a robust dashboard to monitor road conditions through extensive, accurate data.
This enables faster responses, precise assessments, and tailored solutions, resulting in well-maintained, safer roads for everyone.
How does it work?
1
Reading
A vehicle with the sensor passes over a road defect, detects it and sends the data to servers.
2
Elaborate
An AI machine learning software receives the raw data and transforms it into usable information.
3
Display
The condition of the road analysed is displayed on the customer dashboard.
4
Repair
Road workers are sent to the most critical locations to repair the defect.
discovery SECTION
Research
Disney Dreamer workshop
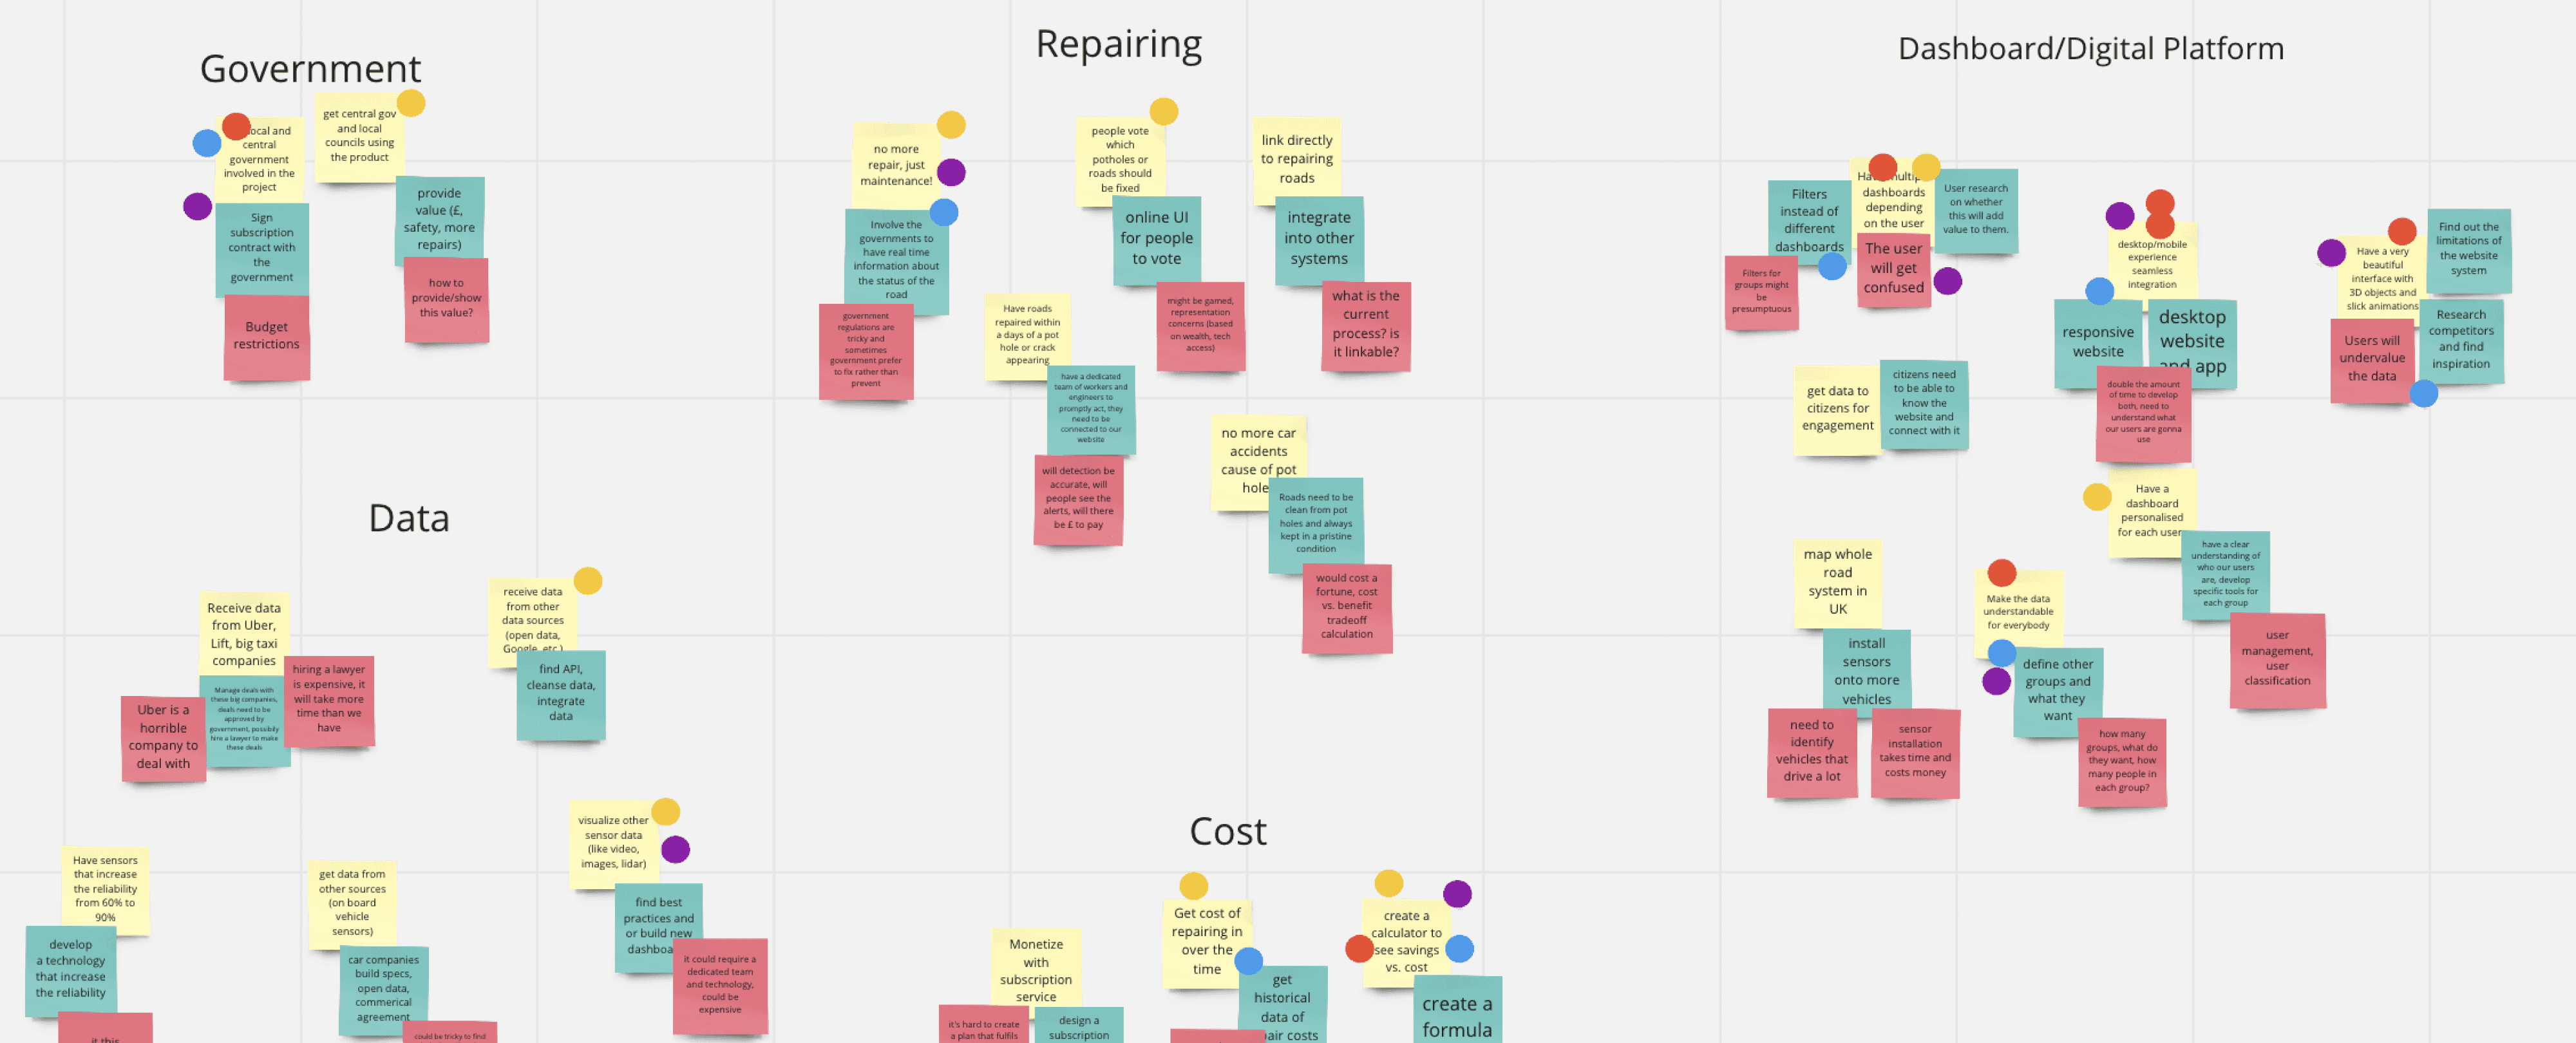
During a focused workshop with six users, including the client, we used the Disney Dreamer framework to explore three key areas:
1. Features and Opportunities - Ideas and specific features were brainstormed.
2. Expectations - We outlined the design deliverables the client expected.
3. Feasibility - Discussed technological constraints related to sensors.
Despite the small group size, the well-planned research yielded significant insights.
Findings
The workshop was useful to understand:
Design Top Priorities
Client Vision of the Product
Users and SMEs interviews
We used Miro for interactive user interviews, mapping out the road repair process. We explored their problems, expectations and habits:
1. Ideal inspection experiences
2. Decision-making variables
3. Pros and cons of similar tech
“It’s all about RISK, isn’t it. That’s how we decide what to fix.”

Laura Perez
Networks consultant • London
“Accuracy is probably the top priority when deciding a repair.”

Katarzyna Nowak
Maintenance manager • Manchester
“False positives are a nightmare!”

Arthur Gauthier
Road inspector • Leeds
Takeaways:
Risk
Councils fix road defects based on their relative risk to the public.
Personalisation
Different councils have different budgets and tolerances so they need solutions personalised for them.
Accuracy
Road repairs are made based on the confidence of the defects’ reads.
discovery SECTION
Research
Disney Dreamer workshop
During a focused workshop with six users, including the client, we used the Disney Dreamer framework to explore three key areas:
1. Features and Opportunities - Ideas and specific features were brainstormed.
2. Expectations - We outlined the design deliverables the client expected.
3. Feasibility - Discussed technological constraints related to sensors.
Despite the small group size, the well-planned research yielded significant insights.
Findings
The workshop was useful to understand:
Design Top Priorities
Client Vision of the Product

Users and SMEs interviews
We used Miro for interactive user interviews, mapping out the road repair process. We explored their problems, expectations and habits:
1. Ideal inspection experiences
2. Decision-making variables
3. Pros and cons of similar tech
“It’s all about RISK, isn’t it. That’s how we decide what to fix.”

Laura Perez
Networks consultant • London
“Accuracy is probably the top priority when deciding a repair.”

Katarzyna Nowak
Maintenance manager • Manchester
“False positives are a nightmare!”

Arthur Gauthier
Road inspector • Leeds
Takeaways:
Risk
Councils fix road defects based on their relative risk to the public.
Personalisation
Different councils have different budgets and tolerances so they need solutions personalised for them.
Accuracy
Road repairs are made based on the confidence of the defects’ reads.
discovery SECTION
Research
Disney Dreamer workshop
During a focused workshop with six users, including the client, we used the Disney Dreamer framework to explore three key areas:
1. Features and Opportunities - Ideas and specific features were brainstormed.
2. Expectations - We outlined the design deliverables the client expected.
3. Feasibility - Discussed technological constraints related to sensors.
Despite the small group size, the well-planned research yielded significant insights.
Findings
The workshop was useful to understand:
Design Top Priorities
Client Vision of the Product

Users and SMEs interviews
We used Miro for interactive user interviews, mapping out the road repair process. We explored their problems, expectations and habits:
1. Ideal inspection experiences
2. Decision-making variables
3. Pros and cons of similar tech
“It’s all about RISK, isn’t it. That’s how we decide what to fix.”

Laura Perez
Networks consultant • London
“Accuracy is probably the top priority when deciding a repair.”

Katarzyna Nowak
Maintenance manager • Manchester
“False positives are a nightmare!”

Arthur Gauthier
Road inspector • Leeds
Takeaways:
Risk
Councils fix road defects based on their relative risk to the public.
Personalisation
Different councils have different budgets and tolerances so they need solutions personalised for them.
Accuracy
Road repairs are made based on the confidence of the defects’ reads.
Synthesis SECTION
Define
Affinity Diagrams
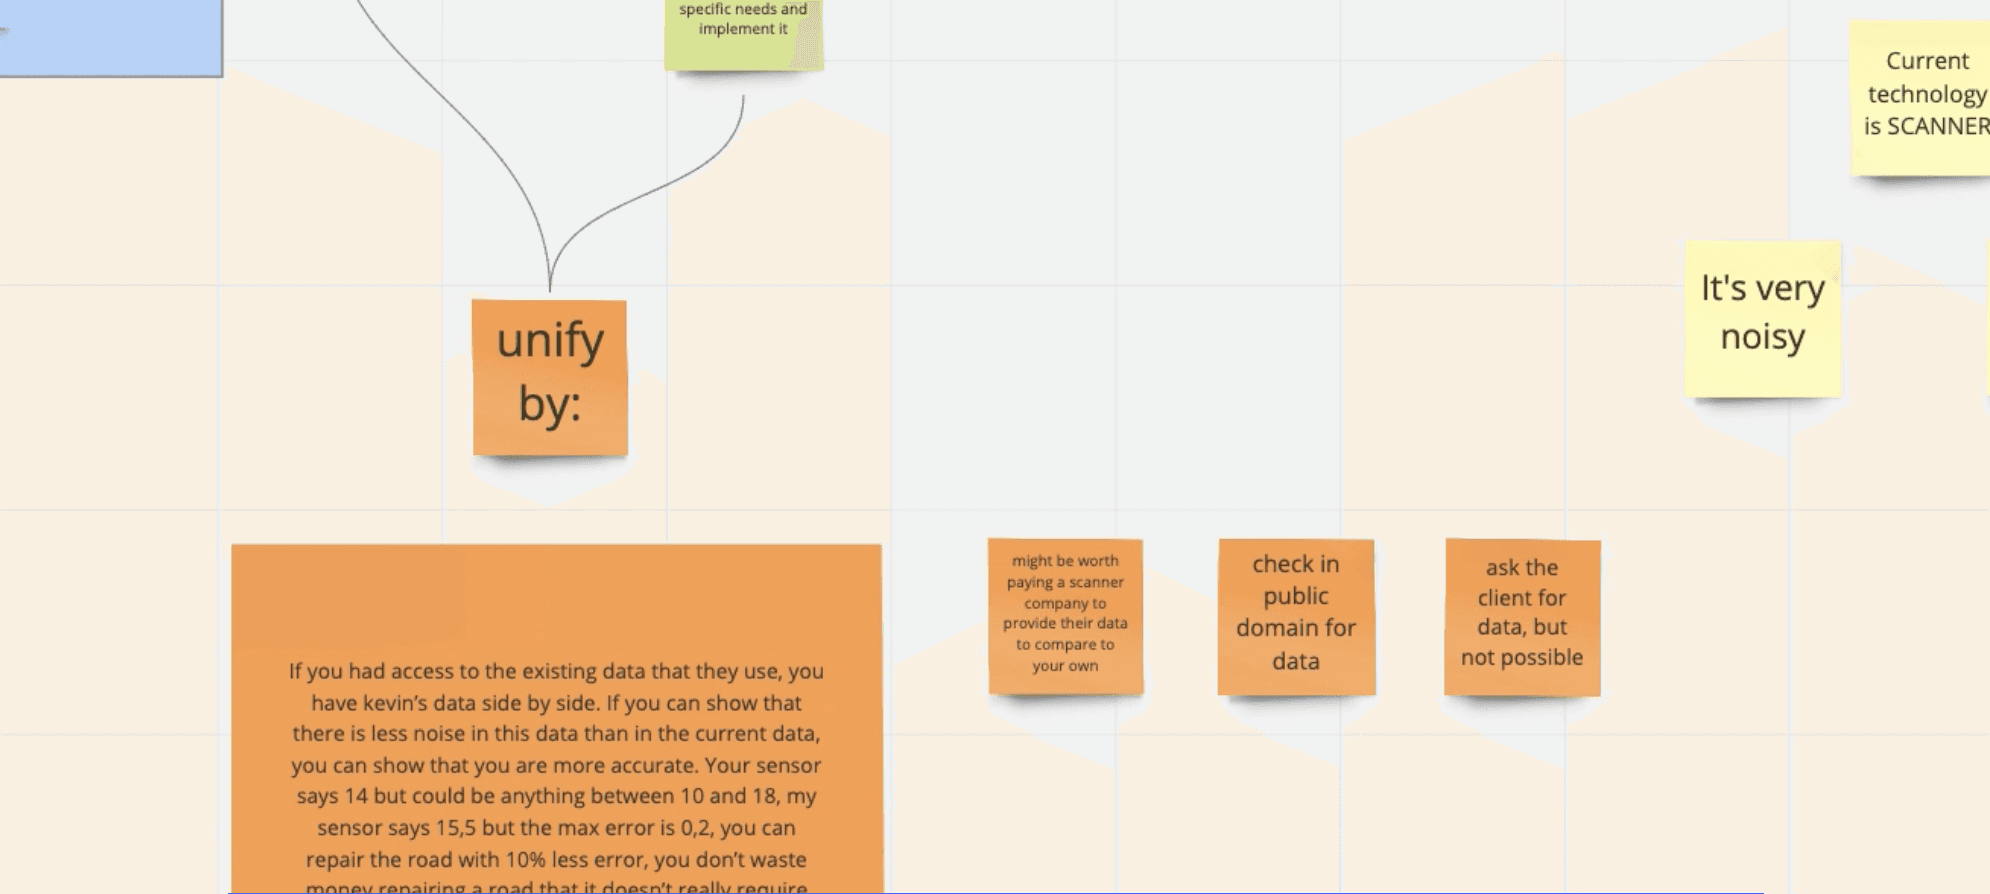
In the defining phase, we used Affinity Diagrams to organize insights, helping us connect the dots and identify patterns. The journey maps from our interviews served as valuable reference points for building these insights.
Persona
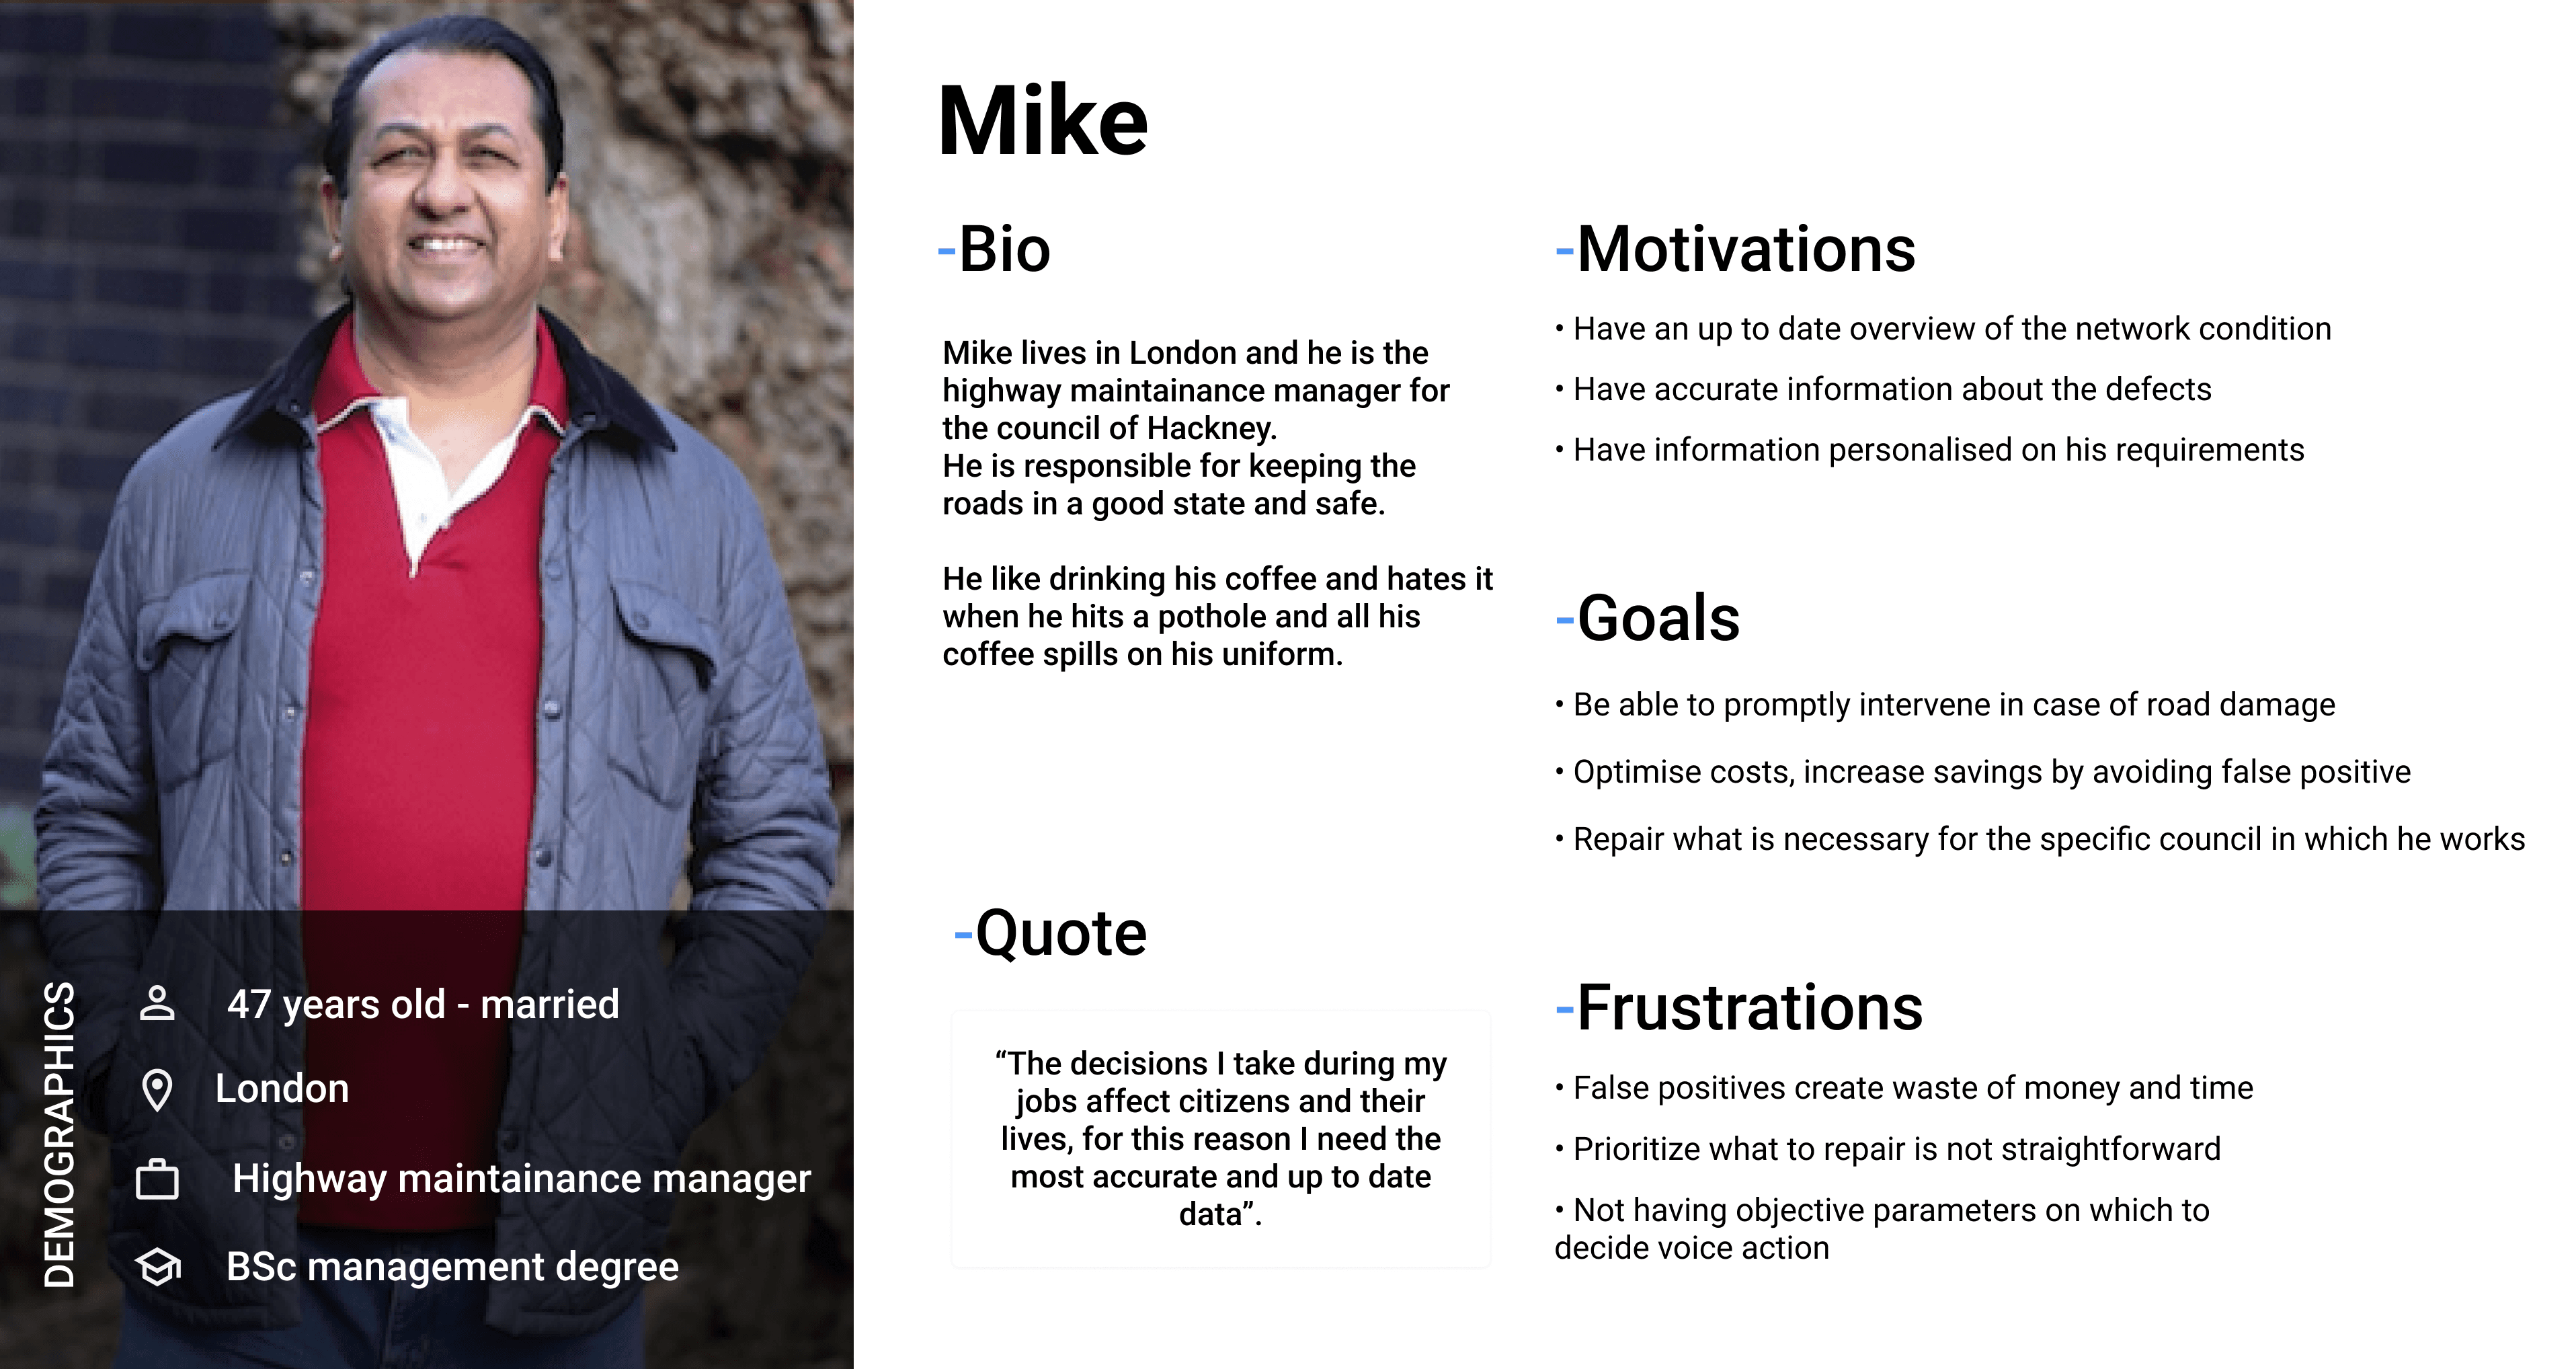
After compiling insights, we created a persona named Mike, based on primary research.
His goals, frustrations, and motivations were shaped by trends observed in user interviews.
Problem statement & design principles
Local authorities need to remove the need for checking in person the status of the roads in their area because it is expensive and not time efficient.
They want to be able to run tailored inspections remotely with the same accuracy as if they were physically there.
Accurate
Provide real value to the fans, respect their passion, expand the experience and avoid anything gimmicky.
Trustable
Users need to trust that our data is precise because that affects directly
their operational costs.
Simple
Information has to be accessible to users with different tech
abilities and be a delight to use.
Flexible
Our product needs to be flexible in order to meet the wide variety
of users’ requirements.
Synthesis SECTION
Define
Affinity Diagrams
In the defining phase, we used Affinity Diagrams to organize insights, helping us connect the dots and identify patterns. The journey maps from our interviews served as valuable reference points for building these insights.

Persona
After compiling insights, we created a persona named Mike, based on primary research.
His goals, frustrations, and motivations were shaped by trends observed in user interviews.

Problem statement & design principles
Local authorities need to remove the need for checking in person the status of the roads in their area because it is expensive and not time efficient.
They want to be able to run tailored inspections remotely with the same accuracy as if they were physically there.
Accurate
Provide real value to the fans, respect their passion, expand the experience and avoid anything gimmicky.
Trustable
Users need to trust that our data is precise because that affects directly
their operational costs.
Simple
Information has to be accessible to users with different tech
abilities and be a delight to use.
Flexible
Our product needs to be flexible in order to meet the wide variety
of users’ requirements.
Synthesis SECTION
Define
Affinity Diagrams
In the defining phase, we used Affinity Diagrams to organize insights, helping us connect the dots and identify patterns. The journey maps from our interviews served as valuable reference points for building these insights.

Persona
After compiling insights, we created a persona named Mike, based on primary research.
His goals, frustrations, and motivations were shaped by trends observed in user interviews.

Problem statement & design principles
Local authorities need to remove the need for checking in person the status of the roads in their area because it is expensive and not time efficient.
They want to be able to run tailored inspections remotely with the same accuracy as if they were physically there.
Accurate
Provide real value to the fans, respect their passion, expand the experience and avoid anything gimmicky.
Trustable
Users need to trust that our data is precise because that affects directly
their operational costs.
Simple
Information has to be accessible to users with different tech
abilities and be a delight to use.
Flexible
Our product needs to be flexible in order to meet the wide variety
of users’ requirements.
design SECTION
Development
Paper Sketching
Scoring system
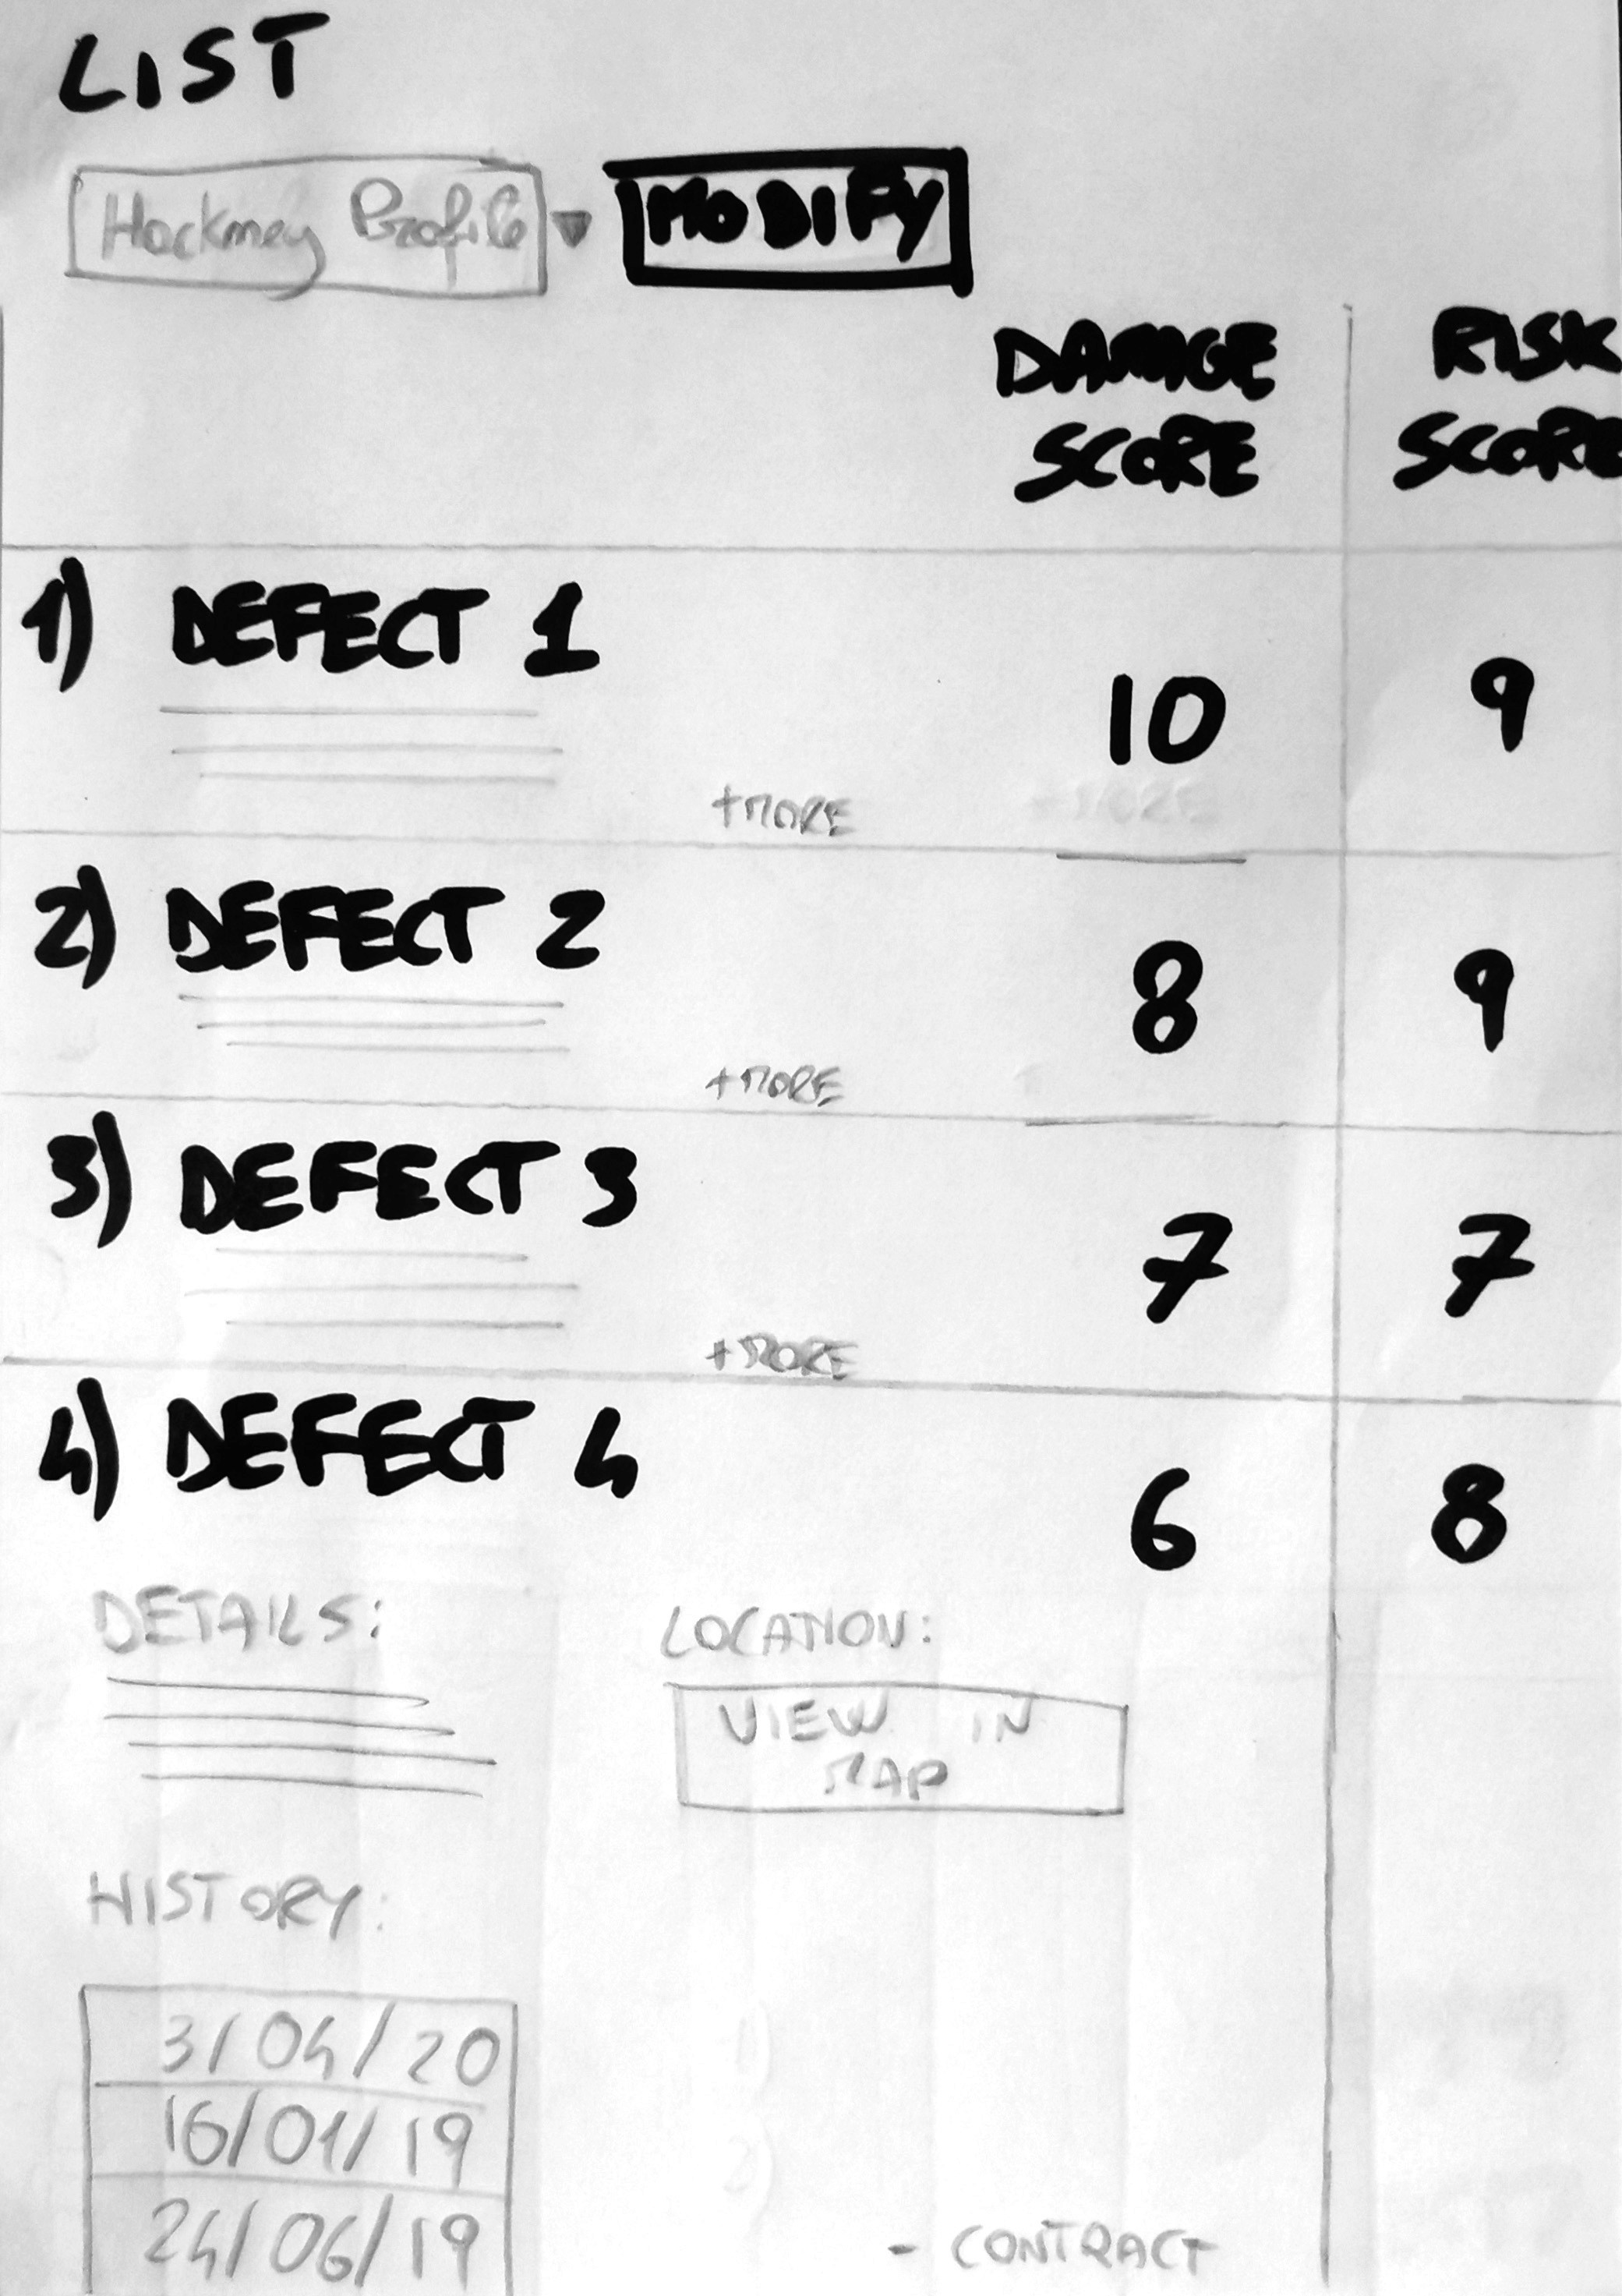
I thought that a scoring system would be the right way to represent and measure some of the metrics we found during our interviews, such as the risk or the accuracy.
Personalisation
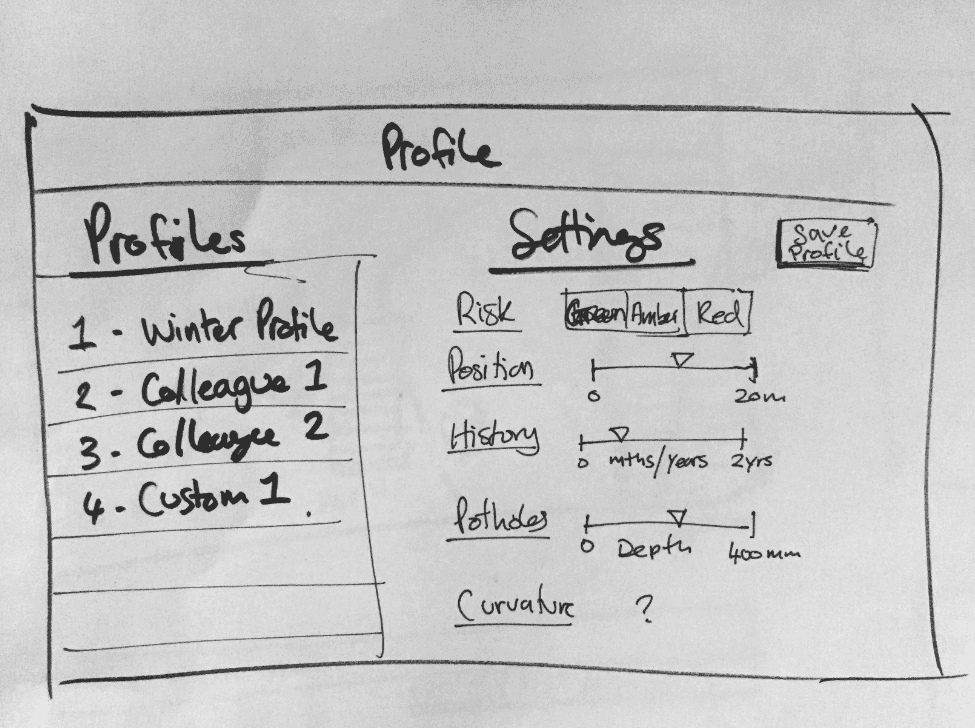
My teammate thought of a system based on profiles that allows users to set their settings based on the standards their authorities use.
Wireframes
We continued iterating and evolved the sketches to a mid/high-fidelity level guided by the user flow we built for Mike.
Our goal was to create a complete end-to-end scenario that we could test with our users during the usability testing.
1
First Iteration
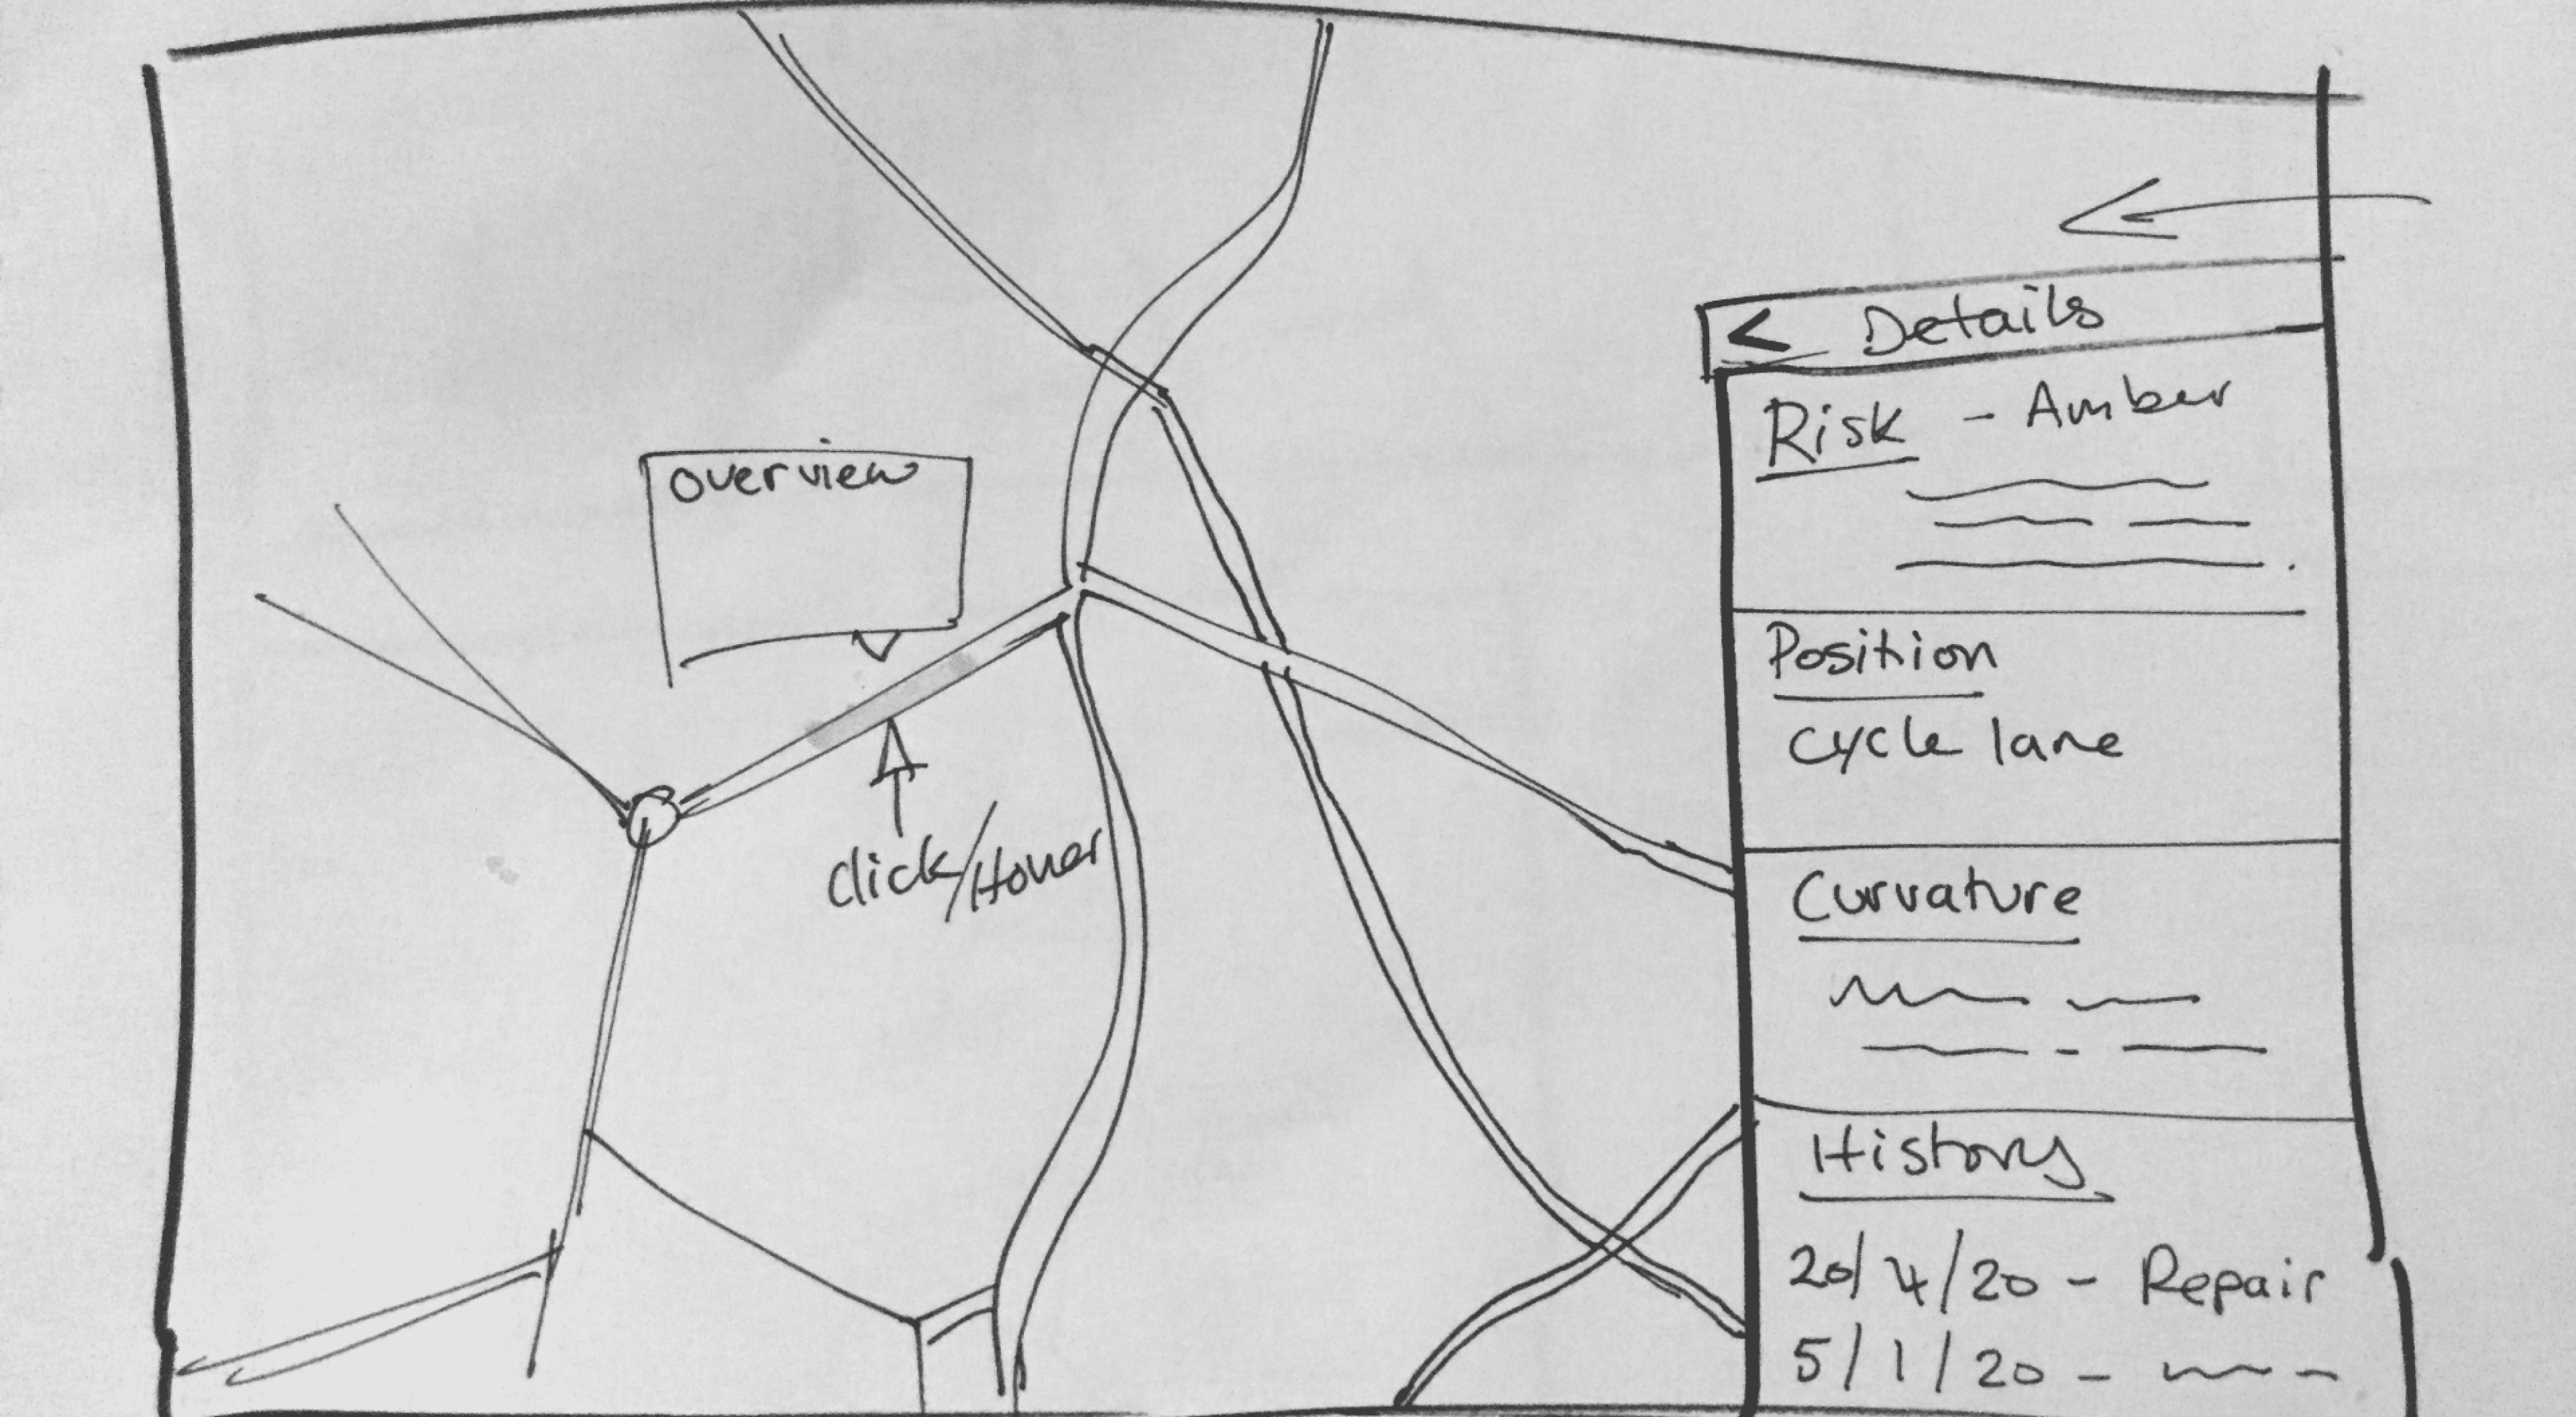
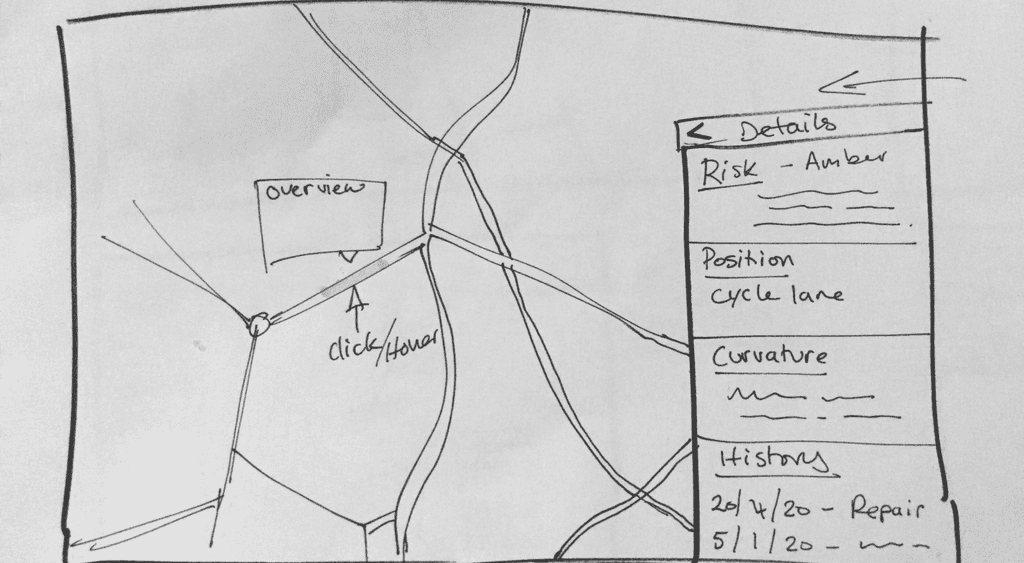
Initial sketches on pen & paper. Already recognisable is the idea of prioritizing as much real estate as possible for the map, and having a side bar to interact with it.
1
First Iteration
2
Second Iteration
3
Final Iteration
Initial sketches on pen & paper. Already recognisable is the idea of prioritizing as much real estate as possible for the map, and having a side bar to interact with it.
2
Second Iteration
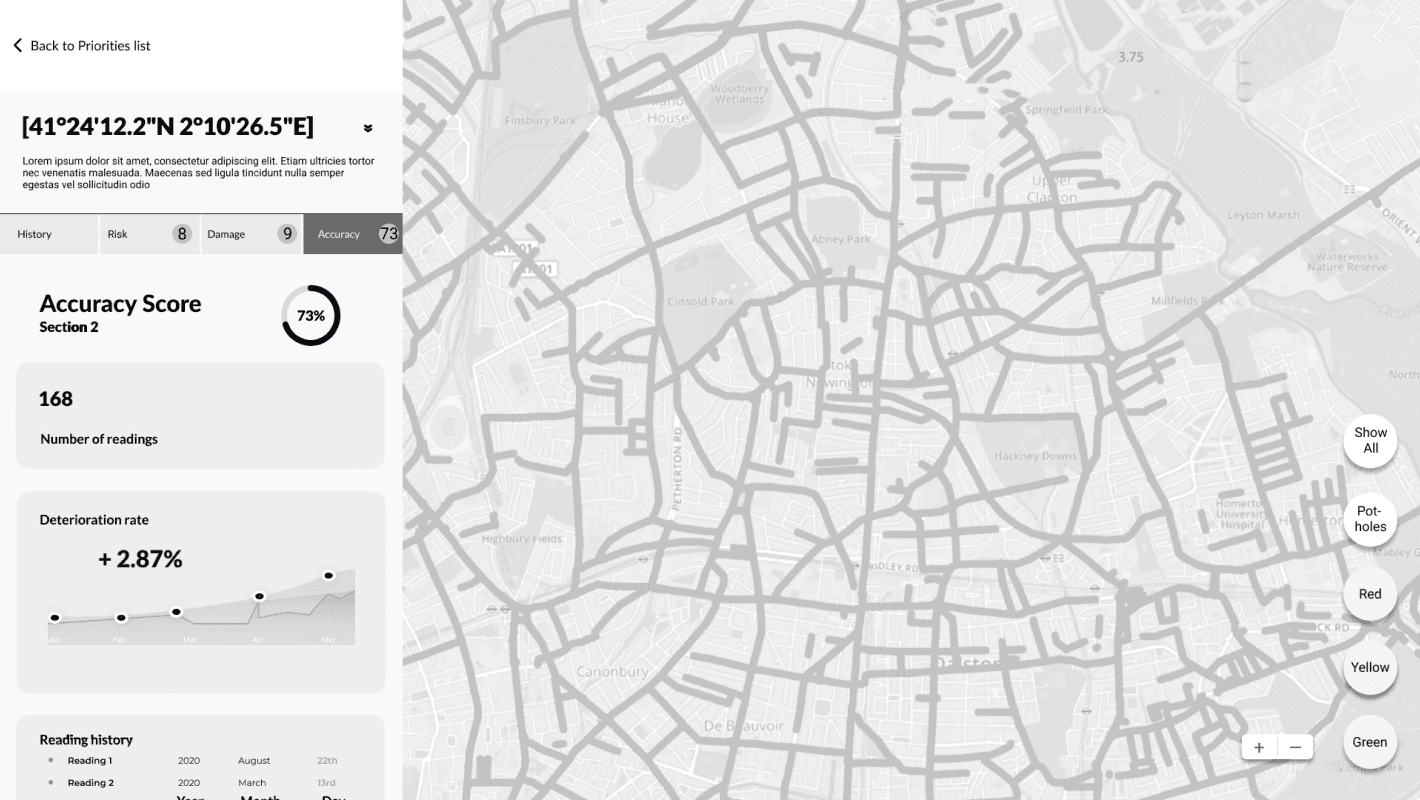
Introducing the main elements of the IA in the side bar: History, Risk, Damage and Accuracy.
3
Final Iteration
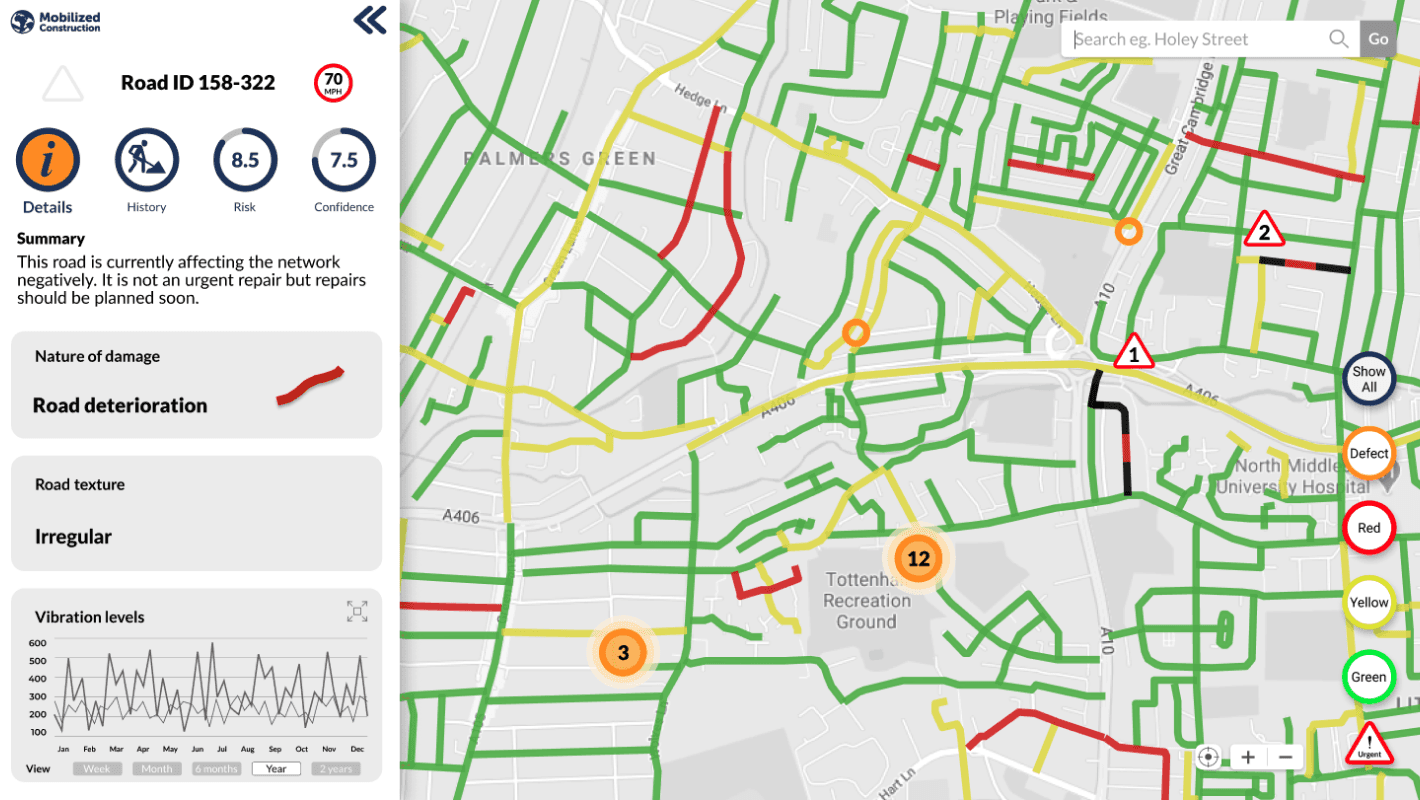
High Fidelity wireframes, tidying up the UI and better-displaying values associated with risk and confidence scores.
Usability Testing
We wanted to validate our designs so we created a working prototype in Figma and based on a scenario, we asked our users to complete 3 tasks.
We collected both qualitative and quantitative feedback and re-iterated it in our wireframes.
Before
1
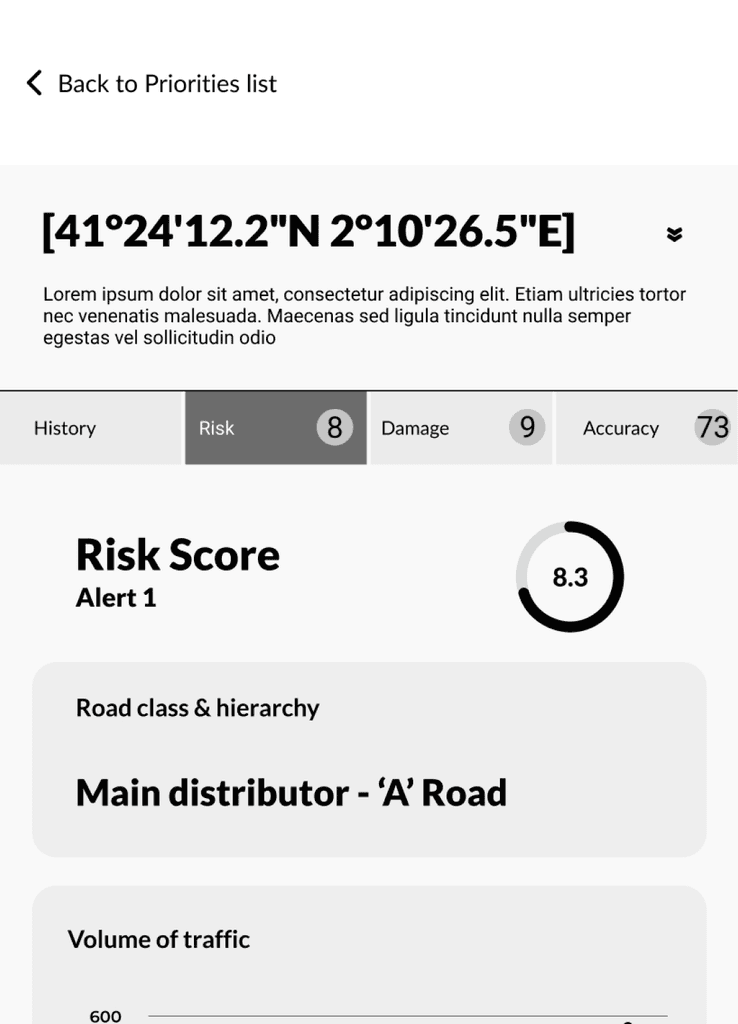
“Why is this score different than the one down there?”
2
“What exactly do you mean by Risk Score?”
3
“What is this score representing?”

1
2
3
After
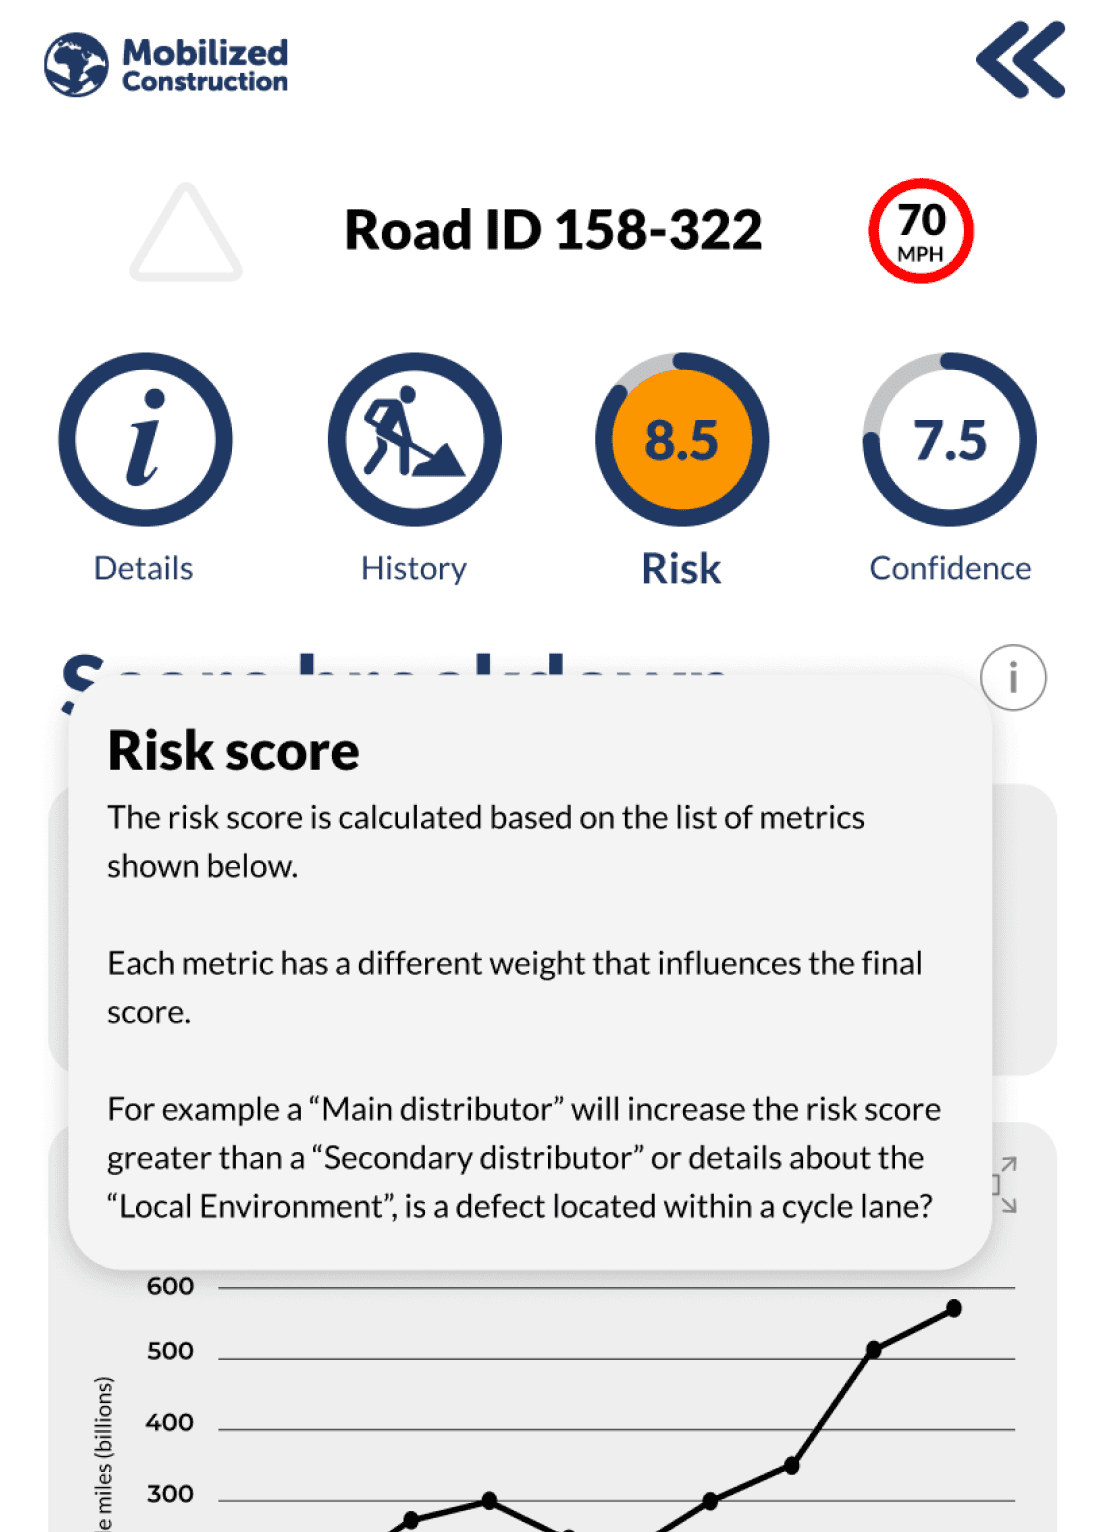
Tooltips have been added to provide an explanation of all the elements and the scores in the UI so users can understand the language and the conventions used throughout the app.
Before
After
1
“Why is this score different than the one down there?”
2
“What exactly do you mean by Risk Score?”
3
“What is this score representing?”
1
2
3
design SECTION
Development
Paper Sketching
Scoring system
I thought that a scoring system would be the right way to represent and measure some of the metrics we found during our interviews, such as the risk or the accuracy.


Personalisation
My teammate thought of a system based on profiles that allows users to set their settings based on the standards their authorities use.
Wireframes
We continued iterating and evolved the sketches to a mid/high-fidelity level guided by the user flow we built for Mike.
Our goal was to create a complete end-to-end scenario that we could test with our users during the usability testing.
1
First Iteration
Initial sketches on pen & paper. Already recognisable is the idea of prioritizing as much real estate as possible for the map, and having a side bar to interact with it.

1
First Iteration
2
Second Iteration
3
Final Iteration
Initial sketches on pen & paper. Already recognisable is the idea of prioritizing as much real estate as possible for the map, and having a side bar to interact with it.

2
Second Iteration
Introducing the main elements of the IA in the side bar: History, Risk, Damage and Accuracy.

3
Final Iteration
High Fidelity wireframes, tidying up the UI and better-displaying values associated with risk and confidence scores.

Usability Testing
We wanted to validate our designs so we created a working prototype in Figma and based on a scenario, we asked our users to complete 3 tasks.
We collected both qualitative and quantitative feedback and re-iterated it in our wireframes.
Before
1
“Why is this score different than the one down there?”
2
“What exactly do you mean by Risk Score?”
3
“What is this score representing?”

1
2
3
After
Tooltips have been added to provide an explanation of all the elements and the scores in the UI so users can understand the language and the conventions used throughout the app.

Before
After
1
“Why is this score different than the one down there?”
2
“What exactly do you mean by Risk Score?”
3
“What is this score representing?”

1
2
3
design SECTION
Development
Paper Sketching
Scoring system
I thought that a scoring system would be the right way to represent and measure some of the metrics we found during our interviews, such as the risk or the accuracy.


Personalisation
My teammate thought of a system based on profiles that allows users to set their settings based on the standards their authorities use.
Wireframes
We continued iterating and evolved the sketches to a mid/high-fidelity level guided by the user flow we built for Mike.
Our goal was to create a complete end-to-end scenario that we could test with our users during the usability testing.
1
First Iteration
Initial sketches on pen & paper. Already recognisable is the idea of prioritizing as much real estate as possible for the map, and having a side bar to interact with it.

1
First Iteration
2
Second Iteration
3
Final Iteration
Initial sketches on pen & paper. Already recognisable is the idea of prioritizing as much real estate as possible for the map, and having a side bar to interact with it.

2
Second Iteration
Introducing the main elements of the IA in the side bar: History, Risk, Damage and Accuracy.

3
Final Iteration
High Fidelity wireframes, tidying up the UI and better-displaying values associated with risk and confidence scores.

Usability Testing
We wanted to validate our designs so we created a working prototype in Figma and based on a scenario, we asked our users to complete 3 tasks.
We collected both qualitative and quantitative feedback and re-iterated it in our wireframes.
Before
1
“Why is this score different than the one down there?”
2
“What exactly do you mean by Risk Score?”
3
“What is this score representing?”

1
2
3
After
Tooltips have been added to provide an explanation of all the elements and the scores in the UI so users can understand the language and the conventions used throughout the app.

Before
After
1
“Why is this score different than the one down there?”
2
“What exactly do you mean by Risk Score?”
3
“What is this score representing?”

1
2
3
solution SECTION
Delivery
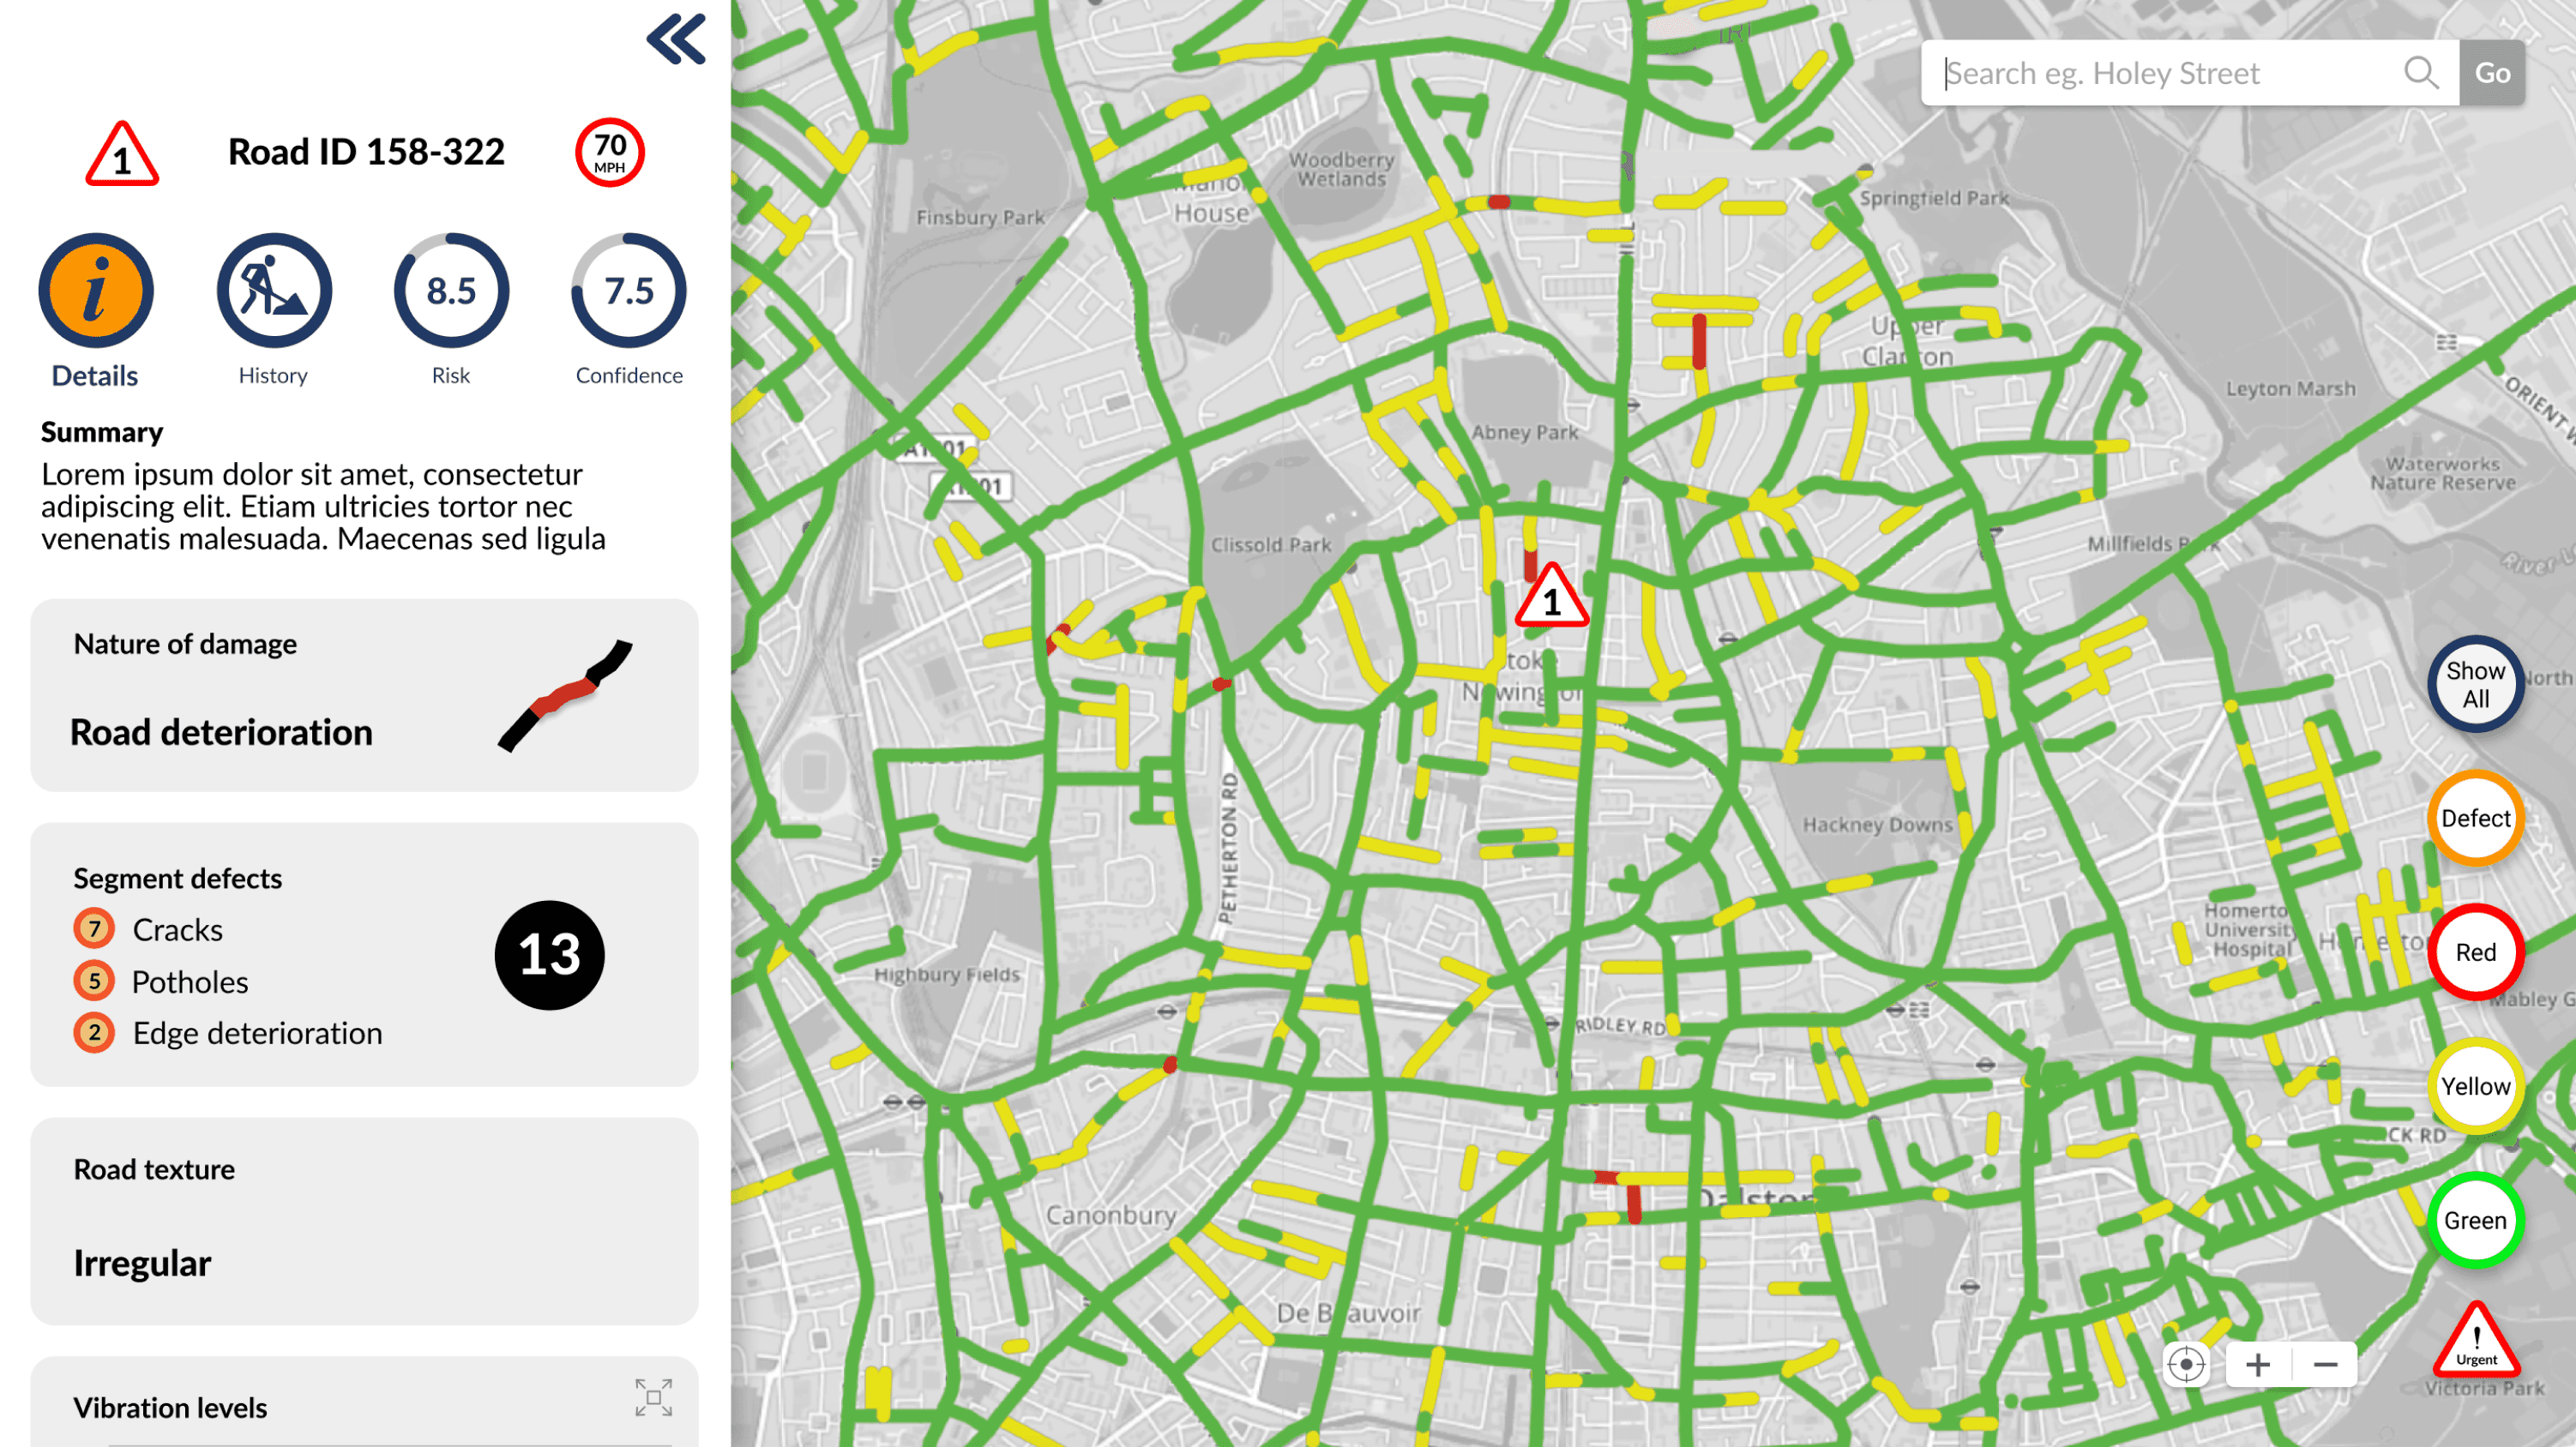
This is the final product of our iteration process. It is the synthesis of all our findings and insights, all aimed at addressing Mike's user needs.
Urgent repairs
Urgent icons displaying the condition of the most critical roads are visible on the map.
By clicking on it, Mike can at a glance see what the top priorities are and have a breakdown of the risk and the accuracy correlated.
Sidebar
The map is still the core of the experience so the sidebar is not intrusive but includes all the most important information Mike would want to know about the network.
Any additional information is shown as overlays that are movable over the map, to give even more freedom.
final SECTION
Conclusion
By the end of three sprints, we delivered an MVP that harmonized technology, business, and user needs.
What began as a "dashboard redesign" evolved into a new system, incorporating previously overlooked UX elements like personalization and risk scoring.
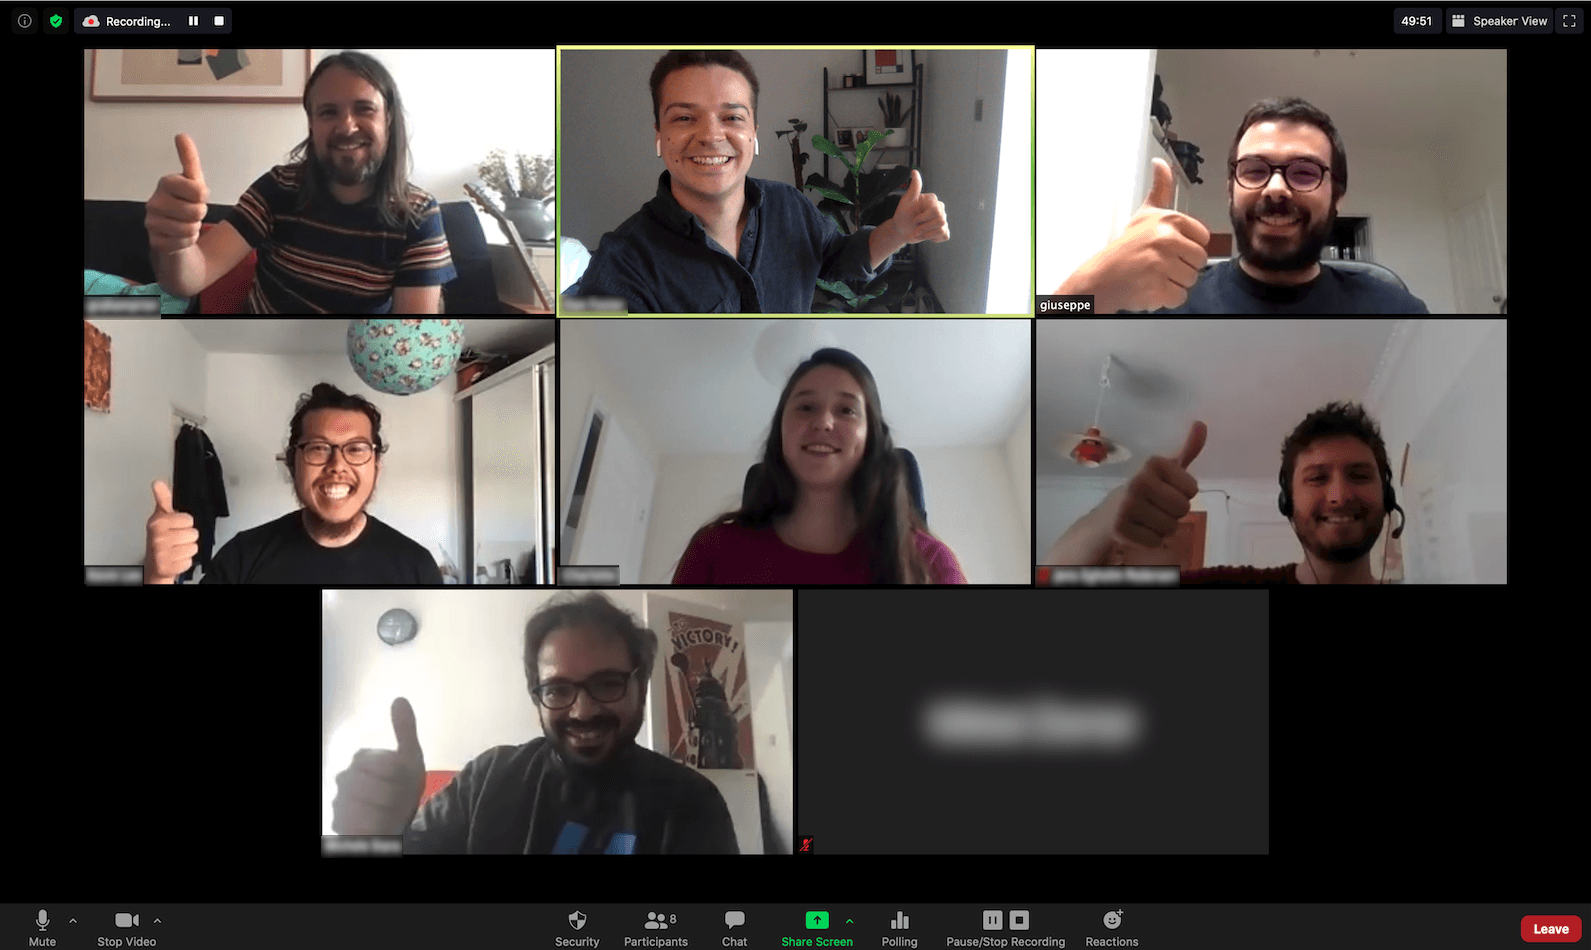
"Thanks for helping with a very successful project. The team was very impressed with your work and we are excited to start to implement elements of it."
Next Step
At the end of the project, we thought that it would be useful to provide our client with a list of the next steps to move forward with Mobilized Construction.
•
Integrate image visualisation of the road (such as Street View).
•
Further user research and iterative process.
•
More in-depth user testing, specifically on the risk score functionalities.
•
Develop and integrate road deterioration forecasts.
final SECTION
Conclusion
By the end of three sprints, we delivered an MVP that harmonized technology, business, and user needs.
What began as a "dashboard redesign" evolved into a new system, incorporating previously overlooked UX elements like personalization and risk scoring.

"Thanks for helping with a very successful project. The team was very impressed with your work and we are excited to start to implement elements of it."
Next Step
At the end of the project, we thought that it would be useful to provide our client with a list of the next steps to move forward with Mobilized Construction.
•
Integrate image visualisation of the road (such as Street View).
•
Further user research and iterative process.
•
More in-depth user testing, specifically on the risk score functionalities.
•
Develop and integrate road deterioration forecasts.
final SECTION
Conclusion
By the end of three sprints, we delivered an MVP that harmonized technology, business, and user needs.
What began as a "dashboard redesign" evolved into a new system, incorporating previously overlooked UX elements like personalization and risk scoring.

"Thanks for helping with a very successful project. The team was very impressed with your work and we are excited to start to implement elements of it."
Next Step
At the end of the project, we thought that it would be useful to provide our client with a list of the next steps to move forward with Mobilized Construction.
•
Integrate image visualisation of the road (such as Street View).
•
Further user research and iterative process.
•
More in-depth user testing, specifically on the risk score functionalities.
•
Develop and integrate road deterioration forecasts.
More case studies
This case study
MOBILIZED CONSTRUCTION
Fixing our roads, one pothole at the time.
Back to Top
Next case study
FOUNDRY (Copy functionality)
Enhancing copy and paste functionalities in the timeline.
Read case study
More case studies
This case study
MOBILIZED CONSTRUCTION
Fixing our roads, one pothole at the time.
Back to Top
Next case study
FOUNDRY (Copy functionality)
Enhancing copy and paste functionalities in the timeline.
Read case study
More case studies
This case study
MOBILIZED CONSTRUCTION
Fixing our roads, one pothole at the time.
Back to Top
Next case study
FOUNDRY (Copy functionality)
Enhancing copy and paste functionalities in the timeline.
Read case study
Promise you that I’ll reply back within 24 hours.
Promise you that I’ll reply back within 24 hours.
Promise you that I’ll reply back within 24 hours.
© 2023 Giuseppe Laterza. All rights reserved.
© 2023 Giuseppe Laterza. All rights reserved.
© 2023 Giuseppe Laterza. All rights reserved.